How to Identify Top Revenue-Potential Pages for Targeted SEO
In the not so distant past (2000-2011ish), projecting growth &/or revenue from SEO efforts was relatively straightforward and often fairly accurate if the right data was available. Various formulas were created for determining the potential of various SEO tasks, but they typically all utilized the same readily available (if not always perfect) ingredients such as:
- Keyword Search Volume
- Current Ranking Position
- Project Ranking Position
- CTR of Current Position
- CTR of Projected Position
- Current Revenue per Organic Visit (keyword specific)
- Projected Revenue per Organic Visit (keyword specific)
From these, it’s not hard to see how to build a formula in which the only guesswork involved is how many positions an SEO believed they could move a site up for a specific keyword. Once experienced, a good search marketer could fairly quickly, and accurately, project revenue gains and even calculate potential ROI.
Then keyword data disappeared and the world of beautiful, data-driven revenue projections for search exploded.
 Yeah, just like that.
Fast-forward to 2016 and we’ve got almost the lowest-level of data we’ve ever had, and the keyword data we do have is rather suspect according to many—myself included. But don’t worry, there are still ways to project revenue gains and identify the best places to direct efforts. Today, I’ll walk you through one of my recent favorites.
A Method for Calculating Organic Revenue Potential at the URL Level
To get started, you’ll need to have access to a few tools:
- An analytics program that has some revenue (or goal) data tied to URLs (almost anything should do this…)
- Google Search Console
With those in hand, we can pull what we need to make this work.
Step 1: Pulling the Data
To start with, download as much data as you can from you’re analytics program that shows the following metrics at the (organic search) landing page level…
- Organic Revenue
- Sessions
- Transactions
- Revenue
As an example, here’s a shot of the report we’d like from Google Analytics:

In the case of Google Analytics, it’s fairly easy to load up thousands of rows of data and export them to an excel file (.xlsx) which is what we’ll want to be working with.
Next, we’ll need to grab Google Search Console data.
For this, we’re really after the following items:
- Pages
- CTR
- Average Position
You could add “clicks” and “impressions” to this list as well, but I prefer to utilize sessions from within an analytics program instead for the calculations we need to make. Within Google Search Console, you’re looking to export a report that will have these data columns:
Update: all data points are pulled down in the pages report when you export, so you want need to click/configure anything special unless you want to.

At this point, you should have a couple of excel documents with the data that needs to be combined. A VLOOKUP() makes short work of this, although depending on how your analytics program outputs URL information, you might need to remove the http://www.site.com from your URLs to make sure they match up with the GSC output. Obviously, if you prefer to go the other way for some reason, you can easily utilize Excel’s CONCATENATE function.
Step 2: Combining Data and Expanding
Once you’ve got your data pulled into one sheet, you can put together something that looks similar to this:
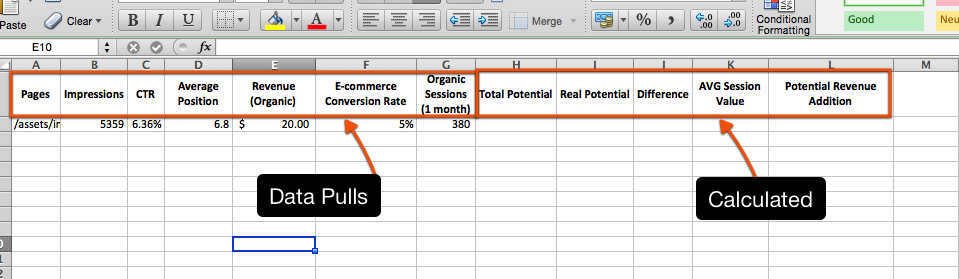
Notice in this shot we have five extra columns with headers. These are values we’re going to calculate and the headings are:
- Total Potential: Total number of sessions that could have been earned (URL level).
For total potential, we are essentially backing into impressions data using sessions from Analytics instead of relying on sessions as reported by GSC. While I don’t believe the sessions data from GSC is bad (in fact at URL level I think it’s one of the more accurate numbers in GSC), I prefer to utilize analytics data as much as possible.
We are answering the question “(session value) is (CTR value) of what number?”
Or, as an example…100 is 5% of what number
- Real Potential: The actual sessions generated, modified by a percentage increase to the CTR of your choice. I like to use something near 2%. From what we’ve seen across various industries and sites, this appears to be a decent average in growth for all URLs on a site across various verticals when standard search efforts are applied. It’s an educated guess and a limitation of the system, but systems from the previous golden era relied on some similar guesswork to project potential position “lift” to a URL.
- Difference: The difference between the current number of reported sessions and projected sessions.
- Average Session Value: The average revenue value of each session generated from organic traffic.
- Potential Revenue Addition: The amount of additional revenue that is projected to be generated after page-level improvements.
Here’s how each of these are calculated:
- Total Potential: Organic Sessions*(100/CTR/100)
- Real Potential: Total Potential*(CTR*.02)
Note: .02 is what is needed to add 2 percent to the current CTR based on how I have excel reading my values. You might need to change this depending on how you have CTR input.
- Difference: Real Potential (-) Sessions
- Average Session Value: Revenue/Sessions
- Potential Revenue Addition: Difference*Average Session Value
When this is done correctly, you’ll have a spreadsheet looking like this (with much more data):

As a bonus, you if you’d like to grab a Google Sheet with the formulas and sample data already available, you can do that here.
Step 3: Evaluating Opportunity
With the data pulled, it’s relatively simple to sort the information by “Revenue Potential” and see which URLs are going to be the best to target for optimization based on their likelihood of returning higher levels of revenue. From here, if you have cost data for various efforts, you could calculate potential ROI.
Another option for reviewing the information would be to adjust the formulas to include increases in sessions based on developing new content to target other topics or keywords for the URL. Obviously, even if the average CTR doesn’t change, but you’re able to earn more exposure for the page, sessions can go up and impact revenue.
Finally, this example specifically targets e-commerce URLs. You could easily adjust the sheet to include URLs that aren’t purchase-specific, but for which you can assign a value to (content tied to assisted conversions might be nice). This would allow you to examine your content and value it appropriately along side your e-commerce or conversion-specific URLs.
Wrapping it Up
This method isn’t perfect, but it does give those interested in answering the question:
“Where should I invest my efforts?”
or…
“Where can I get the best SEO ROI?”
a valuable method for answering those questions.
Here is a quick breakdown of what I see as the strengths and weaknesses in this process:
Strengths
- quick
- provides actionable insight and prioritization for efforts at the URL level
- reasonably accurate
- utilizes data most businesses have
- does not rely on specific keywords, specific tactics, or estimating URL increases
Weaknesses
- see note above
- must estimate a CTR increase
- a bit rough (could be refined by adjusting CTR based on various types of pages, etc.)
- does not take into account potential for ranking for more topics/keywords